
UNITED STATES
SECURITIES AND EXCHANGE COMMISSION
Washington, D.C. 20549
___________________________________
FORM 8-K
___________________________________
CURRENT REPORT
Pursuant to Section 13 or 15(d) of the Securities Exchange Act of 1934
Date of Report (date of earliest event reported)
___________________________________
(Exact name of registrant as specified in its charter)
___________________________________
(State or other jurisdiction of incorporation or organization) | (Commission File Number) | (I.R.S. Employer Identification Number) | ||||||
(Address of principal executive offices and zip code) | ||||||||
( | ||||||||
(Registrant's telephone number, including area code) | ||||||||
Check the appropriate box below if the Form 8-K filing is intended to simultaneously satisfy the filing obligation of the registrant under any of the following provisions:
Written communications pursuant to Rule 425 under the Securities Act (17 CFR 230.425) | |||||
Soliciting material pursuant to Rule 14a-12 under the Exchange Act (17 CFR 240.14a-12) | |||||
Pre-commencement communications pursuant to Rule 14d-2(b) under the Exchange Act (17 CFR 240.14d-2(b)) | |||||
Pre-commencement communications pursuant to Rule 13e-4(c) under the Exchange Act (17 CFR 240.13e-4(c)) | |||||
Securities registered pursuant to Section 12(b) of the Act: | ||||||||
Title of each class | Trading Symbol | Name of each exchange on which registered | ||||||
(Nasdaq Global Select Market) | ||||||||
Indicate by check mark whether the registrant is an emerging growth company as defined in Rule 12b-2 of the Exchange Act.
Emerging growth company ☐
If an emerging growth company, indicate by check mark if the registrant has elected not to use the extended transition period for complying with any new or revised financial accounting standards provided pursuant to Section 13(a) of the Exchange Act. ☐
Item 7.01 Regulation FD Disclosure.
On November 12, 2026, First Watch Restaurant Group, Inc. (the “Company”) will be hosting an investor day in Boston, Massachusetts beginning at 8:30 a.m. Eastern Time. The event can be accessed via live webcast at https://investors.firstwatch.com/news-and-events/events.
In connection with the investor day event, the Company issued a press release on November 9, 2026. A copy of the press release is furnished herewith as Exhibit 99.1. The Company is also furnishing with this Current Report on Form 8-K as Exhibit 99.2 a copy of the investor presentation that was posted on November 12, 2026 to its website at https://investors.firstwatch.com/news-and-events/presentations.
The information furnished in this Current Report on Form 8-K, including Exhibit 99.1 and Exhibit 99.2, shall not be deemed to be “filed” for the purposes of Section 18 of the Securities Exchange Act of 1934, as amended (the “Exchange Act”), or otherwise subject to the liabilities of that section. The information in this Current Report shall not be deemed to be incorporated by reference into any filing under the Securities Act of 1933, as amended, or the Exchange Act, whether made before or after the date of this Current Report, regardless of any general incorporation language in the filing.
Item 9.01 - Financial Statements and Exhibits.
(d) Exhibits.
Exhibit No. | Description | |||||||
99.1 | ||||||||
99.2 | ||||||||
104 | Cover Page Interactive Data File (embedded within the Inline XBRL document) | |||||||
SIGNATURE
Pursuant to the requirements of the Securities Exchange Act of 1934, as amended, the Registrant has duly caused this report to be signed on its behalf by the undersigned hereunto duly authorized.
First Watch Restaurant Group, Inc. (Registrant) | ||||||||
Date: November 12, 2026 | By: | /s/ Ashlee Weisser | ||||||
Name: | Ashlee Weisser | |||||||
Title: | Chief Financial Officer | |||||||
Exhibit 99.1

First Watch Restaurant Group, Inc. to Host Inaugural Investor Day on Thursday, November 12th to Share Strategic Growth Vision
Acceleration of Free Cash Flow Generation Provides Greater Optionality for Capital Allocation Opportunities
BRADENTON, Fla. — November 9, 2026 — First Watch Restaurant Group, Inc. (NASDAQ: FWRG) (“First Watch” or the “Company”), the leading Daytime Dining concept serving breakfast, brunch and lunch, is hosting its Inaugural Investor Day on Thursday, November 12th in Boston, Mass. beginning at 8:30 AM ET.
Investor Day Webcast
Interested parties may join the audio webcast and view the accompanying presentation here:
•https://investors.firstwatch.com/news-and-events/events
The webcast and accompanying presentation will be archived shortly after the event has concluded.
Management Commentary
"Our Investor Day will offer investors a deeper look at what makes First Watch distinctive and why we are confident in the significant opportunity ahead. Our strategy combines the strength of our leadership in Daytime Dining with substantial whitespace for restaurant growth and an increasingly powerful cash flow model. We see a clear path to more than 2,200 restaurants across the continental U.S. while, beginning next year, we expect our robust cash flow to self-fund organic growth and maintenance capital expenditures and accelerate free cash flow generation. That combination gives us the opportunity to extend our leadership in a category we have helped define, continue investing in growth and create meaningful long-term shareholder value,” said Chris Tomasso, CEO and President of First Watch.
“Our annual growth targets through 2028 strike an optimized balance between new unit growth and free cash flow. We are on track to open 62 systemwide restaurants in 2026 and approximately 55 in 2027, retaining flexibility on annual openings in the following years. This measured shift builds on our strong foundation, supports positive and improving free cash flow, reinforces our balance sheet, and gives us greater flexibility in how we deploy capital. Importantly, our confidence in our long-term growth opportunity and earnings power remains unchanged and, towards the end, we recently raised our outlook for annual Adjusted EBITDA growth to greater than 15% for 2027 and 2028,” he concluded.
Annual Growth Targets Through 2028
•Same Restaurant Sales growth of 2% to 4%(1)
•Total Revenue growth of 10% to 13%
•G&A Expense growth lower than Total Revenue growth
•Adjusted EBITDA growth of 15%+
•Positive Free Cash Flow beginning in 2027 and increasing each year
___________________
(1) Includes positive underlying same-restaurant traffic, net of planned sales transfer from new restaurant growth.
1
Definitions
The following definitions apply to these terms as used in this release:
Same-restaurant sales growth: the percentage change in year-over-year restaurant sales (excluding gift card breakage) for the comparable restaurant base, which we define as the number of company-owned First Watch branded restaurants open for 18 months or longer as of the beginning of the fiscal year (“Comparable Restaurant Base”). For the thirteen and thirty-nine weeks ended September 27, 2026 and September 28, 2025, there were 454 restaurants and 381 restaurants, respectively, in our Comparable Restaurant Base. Measuring our same-restaurant sales growth allows management to evaluate the performance of our existing restaurant base. We believe this measure is useful for investors to provide a consistent comparison of restaurant sales results and trends across periods within our core, established restaurant base, unaffected by results of store openings, closings, and other transitional changes.
Same-restaurant traffic growth: the percentage change in year-over-year traffic counts using the Comparable Restaurant Base. Measuring our same-restaurant traffic growth allows management to evaluate the performance of our existing restaurant base. We believe this measure is useful for investors because same-restaurant traffic provides an indicator as to the development of our brand and the effectiveness of our marketing strategy.
Adjusted EBITDA: a non-GAAP measure, represents Net income (loss) before depreciation and amortization, interest expense, income taxes and items that we do not consider in our evaluation of ongoing core operating performance.
Free Cash Flow: a non-GAAP measure, represents Cash Flow from Operations minus capital expenditures.
About First Watch
First Watch is the leading Daytime Dining concept serving made-to-order breakfast, brunch and lunch using the freshest ingredients available. Guided by its “Follow the Sun” culinary philosophy, First Watch's chef-driven menu rotates multiple times per year to feature the highest-quality flavors at their peak, offering elevated executions of classic favorites, fresh juices like the Kale Tonic, and fan favorites such as the Lemon Ricotta Pancakes, Quinoa Power Bowl and signature Million Dollar Bacon. For every kid’s meal served, First Watch proudly donates a portion to organizations and causes making a positive impact in our communities – raising millions to date. A recipient of many “Best Breakfast” and “Best Brunch” awards, First Watch was voted #1 Best Breakfast by Newsweek’s Readers’ Choice Awards 2025, and also named 2025 and 2024’s #1 Most Loved Workplace® in America by the Best Practice Institute – an accolade most recently featured in The Wall Street Journal – after appearing on the list in 2022 and 2023, as well. With a commitment to quality, hospitality and community, First Watch is redefining Daytime Dining across more than 680 restaurants in 33 states. For more information, visit www.firstwatch.com.
Forward-Looking Statements
This release contains forward-looking statements within the meaning of the Private Securities Litigation Reform Act of 1995, which are subject to known and unknown risks, uncertainties and other important factors that may cause actual results to be materially different from the statements made herein. All statements other than statements of historical fact are forward-looking statements. Forward-looking statements discuss our current expectations and projections relating to our financial position, results of operations, plans, objectives, future performance and business. You can identify forward-looking statements by the fact that they do not relate strictly to any historical or current facts. These statements may include words such as “aim,” “anticipate,” “believe,” “estimate,” “expect,” “forecast,” “future,” “intend,”
2
“outlook,” “potential,” “project,” “projection,” “plan,” “seek,” “may,” “could,” “would,” “will,” “should,” “can,” “can have,” “likely,” the negatives thereof and other similar expressions. Examples of forward-looking statements include, but are not limited to, statements we make regarding the outlook for our future business and financial performance and statements discussing our current expectations and projections relating to our financial position, results of operations, plans, objectives, future performance and business. Forward-looking statements are based on our current expectations and assumptions regarding our business, the economy and other future conditions. Because forward-looking statements relate to the future, by their nature, they are subject to inherent uncertainties, risks and changes in circumstances that are difficult to predict. As a result, our actual results may differ materially from those contemplated by the forward-looking statements. Important factors that could cause actual results to differ materially from those in the forward-looking statements include:
•our vulnerability to changes in consumer preferences and economic conditions such as inflation and recession;
•our inability to successfully open new restaurants or establish new markets;
•our inability to effectively manage our growth;
•potential negative impacts on sales at our and our franchisees’ restaurants as a result of our opening new restaurants in existing markets;
•a decline in visitors to any of the retail centers, lifestyle centers, or entertainment centers where our restaurants are located;
•lower than expected same-restaurant sales growth;
•unsuccessful marketing programs and limited time new offerings;
•changes in the cost of food;
•unprofitability or closure of new restaurants or lower than previously experienced performance in existing restaurants;
•our inability to compete effectively for customers;
•our vulnerability to food safety and food-borne illness concerns;
•unsuccessful financial performance of our franchisees;
•our limited control over our franchisees’ operations;
•our inability to maintain good relationships with our franchisees and conflicts of interest with our franchisees;
•the geographic concentration of our system-wide restaurant base in the southeast portion of the United States;
•damage to our reputation and negative publicity;
•our inability or failure to recognize, respond to and effectively manage the accelerated impact of social media and artificial intelligence;
•our limited number of suppliers and distributors for several of our frequently used ingredients and shortages or disruptions in the supply or delivery of such ingredients;
•information technology system failures or breaches of our network security;
•our failure to comply with federal and state laws and regulations relating to privacy, data protection, advertising and consumer protection, or the expansion of current or the enactment of new laws or regulations relating to privacy, data protection, advertising and consumer protection;
•our potential liability with our gift cards under the property laws of some states;
•our failure to enforce and maintain our trademarks and protect our other intellectual property;
•litigation with respect to intellectual property assets;
•our dependence on our executive officers and certain other key employees;
•our inability to identify, hire, train and retain qualified individuals for our workforce;
•our failure to obtain or to properly verify the employment eligibility of our employees;
•our failure to maintain our corporate culture as we grow;
•unionization activities among our employees;
•employment and labor law proceedings;
•labor shortages or increased labor costs or health care costs;
•risks associated with leasing property subject to long-term and non-cancelable leases;
•risks related to our sale of alcoholic beverages;
3
•costly and complex compliance with federal, state and local laws, including trade and tax policies;
•changes in accounting principles applicable to us;
•our vulnerability to natural disasters, unusual weather conditions, pandemic outbreaks, political events, war and terrorism;
•our inability to secure additional capital to support business growth;
•our level of indebtedness;
•failure to comply with covenants under our credit facility; and
•uncertainty regarding the Russia and Ukraine war, war and unrest in the Middle East and the related impact on macroeconomic conditions, including inflation, as a result of such conflicts or other related events.
See Part I. Item 1A. “Risk Factors” in our Annual Report on Form 10-K as of and for the year ended December 28, 2025 (“2025 Form 10-K”) for a further description of these and other factors. For the reasons described above, we caution you against relying on any forward-looking statements, which should also be read in conjunction with the other cautionary statements that are included elsewhere in this press release and in our filings with the Securities and Exchange Commission (the “SEC”). Any forward-looking statement made by us in this press release speaks only as of the date hereof and is expressly qualified in its entirety by these cautionary statements. Factors or events that could cause our actual results to differ may emerge from time to time, and it is not possible for us to predict all of them. We undertake no obligation to publicly update or revise any forward-looking statement, whether as a result of new information, future developments or otherwise, except as may be required by law.
Investor Relations Contact
Steven L. Marotta
941-500-1918
investors@firstwatch.com
Media Relations Contact
Jenni Glester
407-864-5823
jglester@firstwatch.com
4

© 2026 First Watch Restaurant Group, Inc. All Rights Reserved. Exhibit 99.29.2
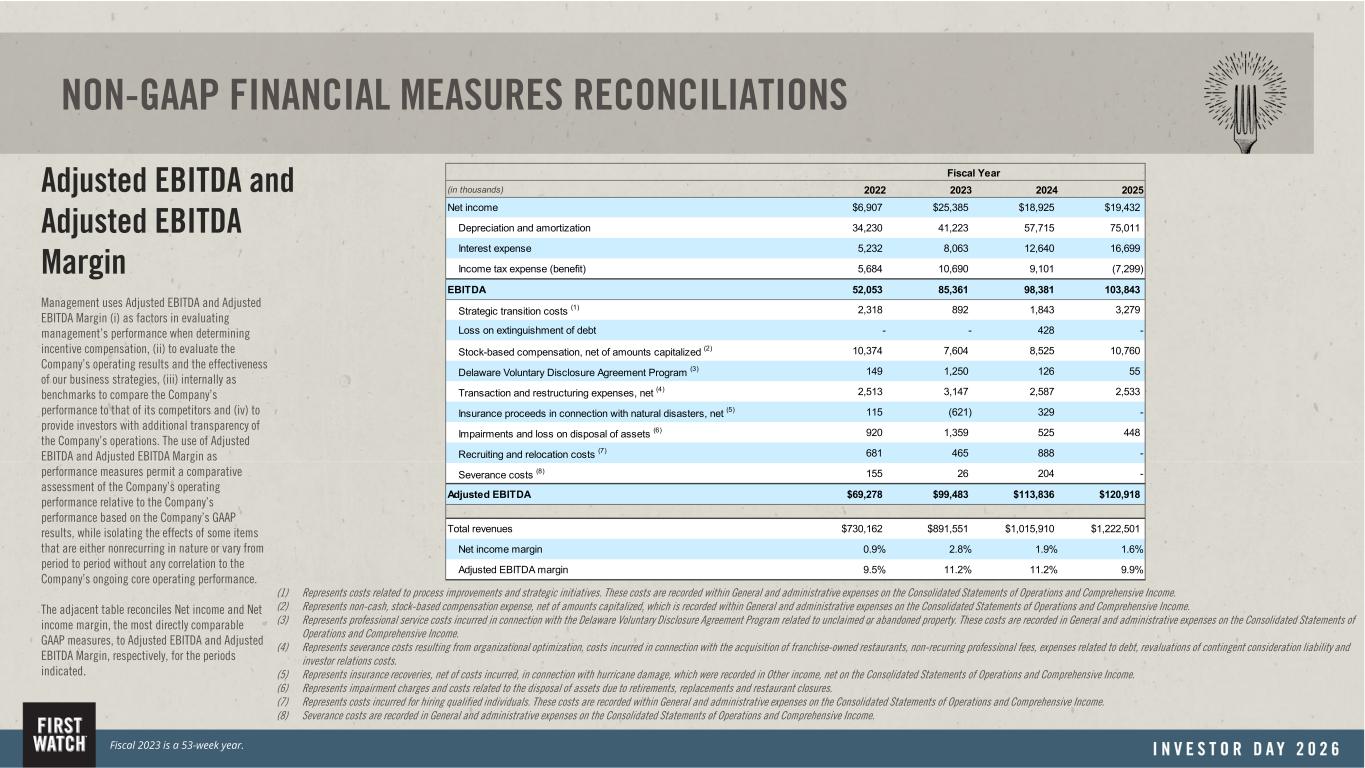
NON-GAAP FINANCIAL MEASURES RECONCILIATIONS Adjusted EBITDA and Adjusted EBITDA Margin Management uses Adjusted EBITDA and Adjusted EBITDA Margin (i) as factors in evaluating management’s performance when determining incentive compensation, (ii) to evaluate the Company’s operating results and the effectiveness of our business strategies, (iii) internally as benchmarks to compare the Company’s performance to that of its competitors and (iv) to provide investors with additional transparency of the Company’s operations. The use of Adjusted EBITDA and Adjusted EBITDA Margin as performance measures permit a comparative assessment of the Company’s operating performance relative to the Company’s performance based on the Company’s GAAP results, while isolating the effects of some items that are either nonrecurring in nature or vary from period to period without any correlation to the Company’s ongoing core operating performance. The adjacent table reconciles Net income and Net income margin, the most directly comparable GAAP measures, to Adjusted EBITDA and Adjusted EBITDA Margin, respectively, for the periods indicated. (1) Represents costs related to process improvements and strategic initiatives. These costs are recorded within General and administrative expenses on the Consolidated Statements of Operations and Comprehensive Income. (2) Represents non-cash, stock-based compensation expense, net of amounts capitalized, which is recorded within General and administrative expenses on the Consolidated Statements of Operations and Comprehensive Income. (3) Represents professional service costs incurred in connection with the Delaware Voluntary Disclosure Agreement Program related to unclaimed or abandoned property. These costs are recorded in General and administrative expenses on the Consolidated Statements of Operations and Comprehensive Income. (4) Represents severance costs resulting from organizational optimization, costs incurred in connection with the acquisition of franchise-owned restaurants, non-recurring professional fees, expenses related to debt, revaluations of contingent consideration liability and investor relations costs. (5) Represents insurance recoveries, net of costs incurred, in connection with hurricane damage, which were recorded in Other income, net on the Consolidated Statements of Operations and Comprehensive Income. (6) Represents impairment charges and costs related to the disposal of assets due to retirements, replacements and restaurant closures. (7) Represents costs incurred for hiring qualified individuals. These costs are recorded within General and administrative expenses on the Consolidated Statements of Operations and Comprehensive Income. (8) Severance costs are recorded in General and administrative expenses on the Consolidated Statements of Operations and Comprehensive Income. Fiscal 2023 is a 53-week year. (in thousands) 2022 2023 2024 2025 Net income $6,907 $25,385 $18,925 $19,432 Depreciation and amortization 34,230 41,223 57,715 75,011 Interest expense 5,232 8,063 12,640 16,699 Income tax expense (benefit) 5,684 10,690 9,101 (7,299) EBITDA 52,053 85,361 98,381 103,843 Strategic transition costs (1) 2,318 892 1,843 3,279 Loss on extinguishment of debt - - 428 - Stock-based compensation, net of amounts capitalized (2) 10,374 7,604 8,525 10,760 Delaware Voluntary Disclosure Agreement Program (3) 149 1,250 126 55 Transaction and restructuring expenses, net (4) 2,513 3,147 2,587 2,533 Insurance proceeds in connection with natural disasters, net (5) 115 (621) 329 - Impairments and loss on disposal of assets (6) 920 1,359 525 448 Recruiting and relocation costs (7) 681 465 888 - Severance costs (8) 155 26 204 - Adjusted EBITDA $69,278 $99,483 $113,836 $120,918 Total revenues $730,162 $891,551 $1,015,910 $1,222,501 Net income margin 0.9% 2.8% 1.9% 1.6% Adjusted EBITDA margin 9.5% 11.2% 11.2% 9.9% Fiscal Year
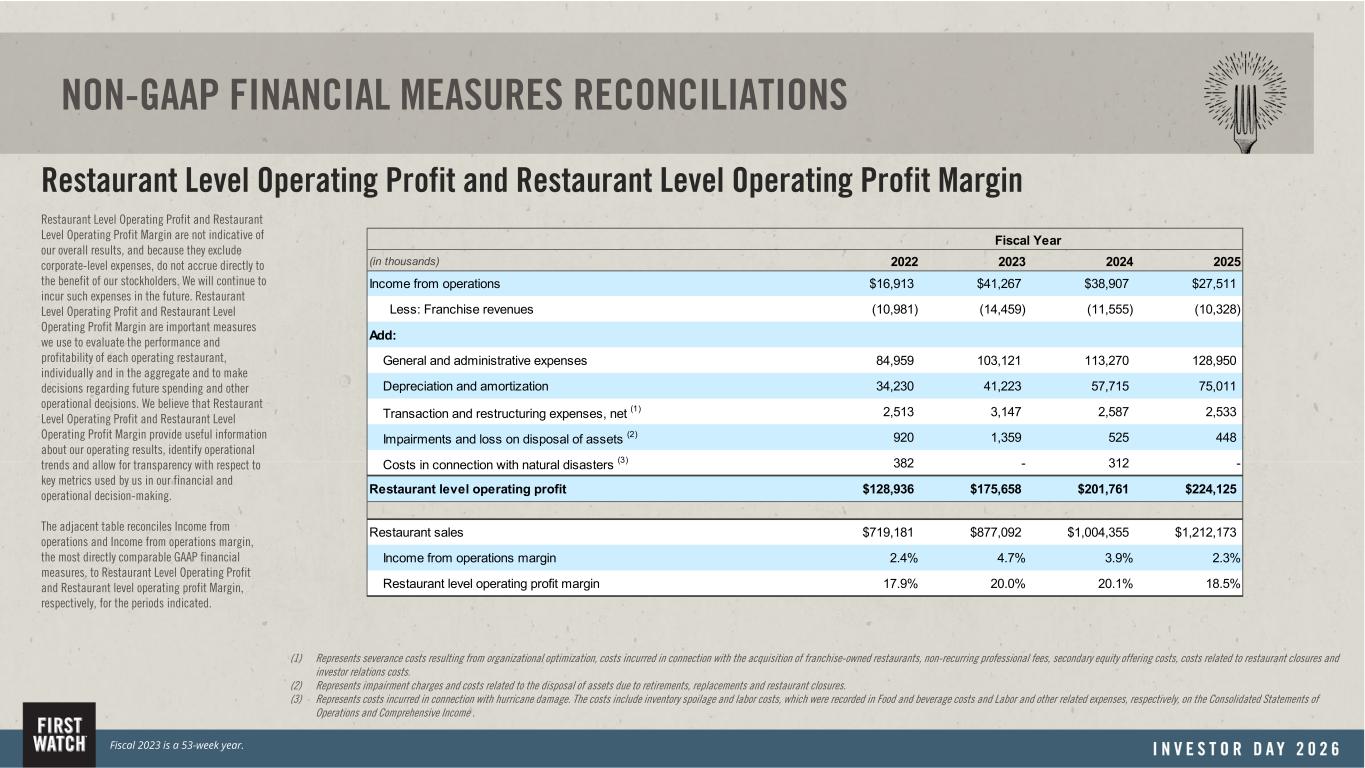
NON-GAAP FINANCIAL MEASURES RECONCILIATIONS Restaurant Level Operating Profit and Restaurant Level Operating Profit Margin Restaurant Level Operating Profit and Restaurant Level Operating Profit Margin are not indicative of our overall results, and because they exclude corporate-level expenses, do not accrue directly to the benefit of our stockholders. We will continue to incur such expenses in the future. Restaurant Level Operating Profit and Restaurant Level Operating Profit Margin are important measures we use to evaluate the performance and profitability of each operating restaurant, individually and in the aggregate and to make decisions regarding future spending and other operational decisions. We believe that Restaurant Level Operating Profit and Restaurant Level Operating Profit Margin provide useful information about our operating results, identify operational trends and allow for transparency with respect to key metrics used by us in our financial and operational decision-making. The adjacent table reconciles Income from operations and Income from operations margin, the most directly comparable GAAP financial measures, to Restaurant Level Operating Profit and Restaurant level operating profit Margin, respectively, for the periods indicated. (1) Represents severance costs resulting from organizational optimization, costs incurred in connection with the acquisition of franchise-owned restaurants, non-recurring professional fees, secondary equity offering costs, costs related to restaurant closures and investor relations costs. (2) Represents impairment charges and costs related to the disposal of assets due to retirements, replacements and restaurant closures. (3) Represents costs incurred in connection with hurricane damage. The costs include inventory spoilage and labor costs, which were recorded in Food and beverage costs and Labor and other related expenses, respectively, on the Consolidated Statements of Operations and Comprehensive Income . Fiscal 2023 is a 53-week year. (in thousands) 2022 2023 2024 2025 Income from operations $16,913 $41,267 $38,907 $27,511 Less: Franchise revenues (10,981) (14,459) (11,555) (10,328) Add: General and administrative expenses 84,959 103,121 113,270 128,950 Depreciation and amortization 34,230 41,223 57,715 75,011 Transaction and restructuring expenses, net (1) 2,513 3,147 2,587 2,533 Impairments and loss on disposal of assets (2) 920 1,359 525 448 Costs in connection with natural disasters (3) 382 - 312 - Restaurant level operating profit $128,936 $175,658 $201,761 $224,125 Restaurant sales $719,181 $877,092 $1,004,355 $1,212,173 Income from operations margin 2.4% 4.7% 3.9% 2.3% Restaurant level operating profit margin 17.9% 20.0% 20.1% 18.5% Fiscal Year
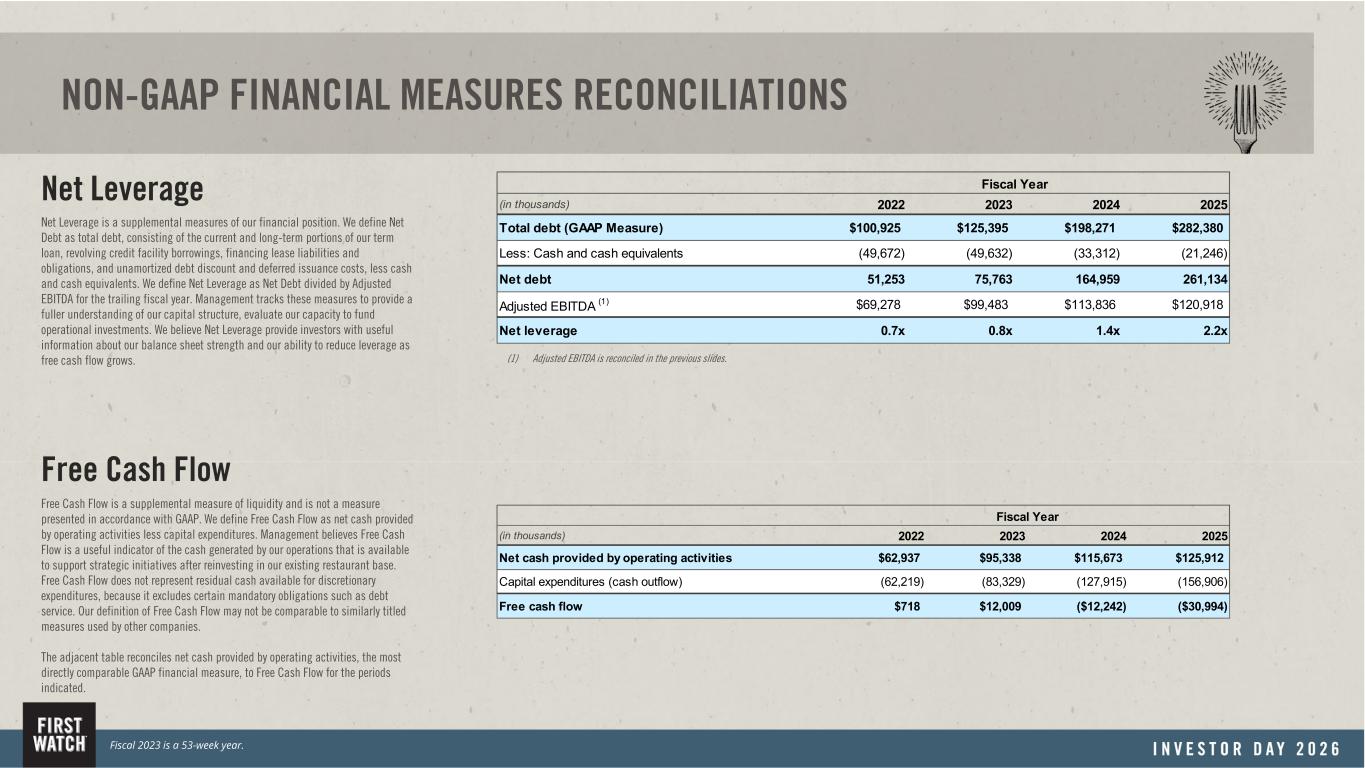
NON-GAAP FINANCIAL MEASURES RECONCILIATIONS Net Leverage Net Leverage is a supplemental measures of our financial position. We define Net Debt as total debt, consisting of the current and long-term portions of our term loan, revolving credit facility borrowings, financing lease liabilities and obligations, and unamortized debt discount and deferred issuance costs, less cash and cash equivalents. We define Net Leverage as Net Debt divided by Adjusted EBITDA for the trailing fiscal year. Management tracks these measures to provide a fuller understanding of our capital structure, evaluate our capacity to fund operational investments. We believe Net Leverage provide investors with useful information about our balance sheet strength and our ability to reduce leverage as free cash flow grows. Fiscal 2023 is a 53-week year. Free Cash Flow Free Cash Flow is a supplemental measure of liquidity and is not a measure presented in accordance with GAAP. We define Free Cash Flow as net cash provided by operating activities less capital expenditures. Management believes Free Cash Flow is a useful indicator of the cash generated by our operations that is available to support strategic initiatives after reinvesting in our existing restaurant base. Free Cash Flow does not represent residual cash available for discretionary expenditures, because it excludes certain mandatory obligations such as debt service. Our definition of Free Cash Flow may not be comparable to similarly titled measures used by other companies. The adjacent table reconciles net cash provided by operating activities, the most directly comparable GAAP financial measure, to Free Cash Flow for the periods indicated. (1) Adjusted EBITDA is reconciled in the previous slides. (in thousands) 2022 2023 2024 2025 Total debt (GAAP Measure) $100,925 $125,395 $198,271 $282,380 Less: Cash and cash equivalents (49,672) (49,632) (33,312) (21,246) Net debt 51,253 75,763 164,959 261,134 Adjusted EBITDA (1) $69,278 $99,483 $113,836 $120,918 Net leverage 0.7x 0.8x 1.4x 2.2x Fiscal Year (in thousands) 2022 2023 2024 2025 Net cash provided by operating activities $62,937 $95,338 $115,673 $125,912 Capital expenditures (cash outflow) (62,219) (83,329) (127,915) (156,906) Free cash flow $718 $12,009 ($12,242) ($30,994) Fiscal Year
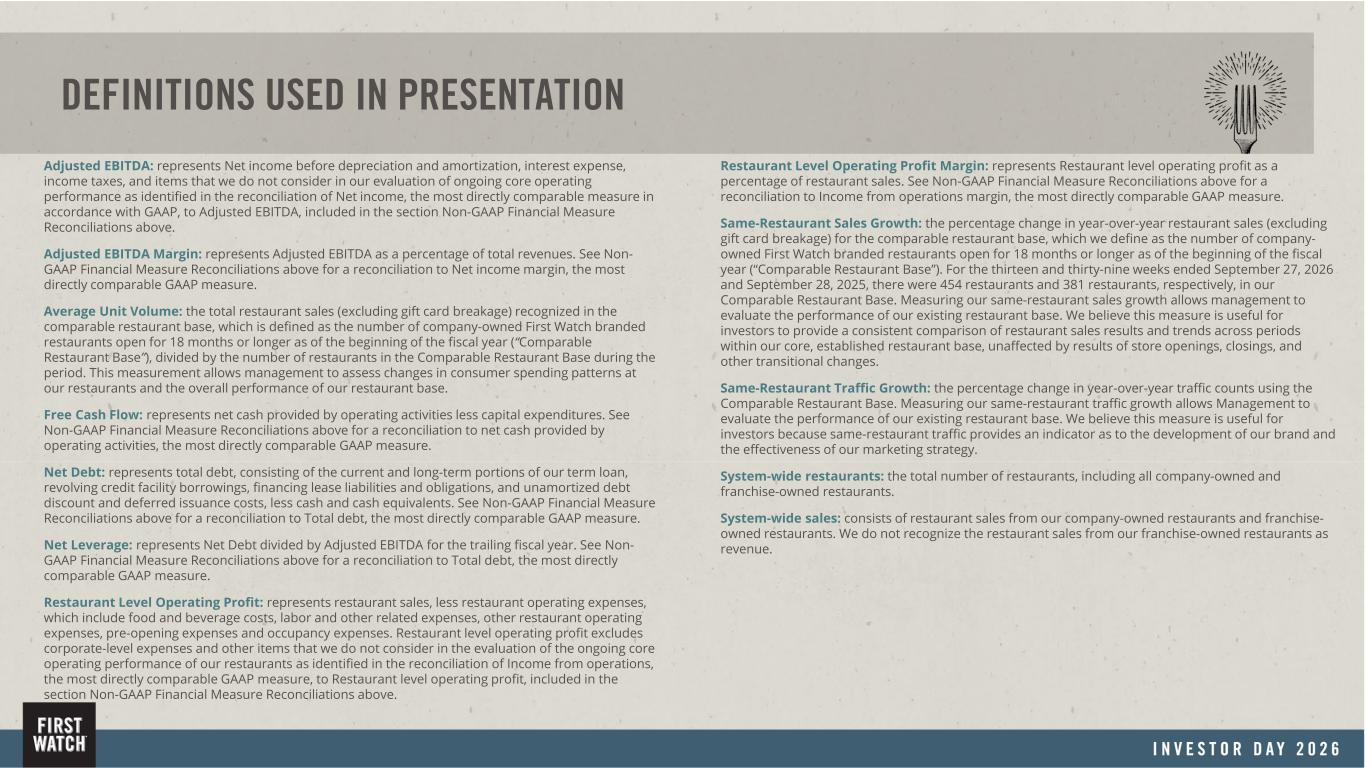
DEFINITIONS USED IN PRESENTATION Adjusted EBITDA: represents Net income before depreciation and amortization, interest expense, income taxes, and items that we do not consider in our evaluation of ongoing core operating performance as identified in the reconciliation of Net income, the most directly comparable measure in accordance with GAAP, to Adjusted EBITDA, included in the section Non-GAAP Financial Measure Reconciliations above. Adjusted EBITDA Margin: represents Adjusted EBITDA as a percentage of total revenues. See Non- GAAP Financial Measure Reconciliations above for a reconciliation to Net income margin, the most directly comparable GAAP measure. Average Unit Volume: the total restaurant sales (excluding gift card breakage) recognized in the comparable restaurant base, which is defined as the number of company-owned First Watch branded restaurants open for 18 months or longer as of the beginning of the fiscal year (“Comparable Restaurant Base”), divided by the number of restaurants in the Comparable Restaurant Base during the period. This measurement allows management to assess changes in consumer spending patterns at our restaurants and the overall performance of our restaurant base. Free Cash Flow: represents net cash provided by operating activities less capital expenditures. See Non-GAAP Financial Measure Reconciliations above for a reconciliation to net cash provided by operating activities, the most directly comparable GAAP measure. Net Debt: represents total debt, consisting of the current and long-term portions of our term loan, revolving credit facility borrowings, financing lease liabilities and obligations, and unamortized debt discount and deferred issuance costs, less cash and cash equivalents. See Non-GAAP Financial Measure Reconciliations above for a reconciliation to Total debt, the most directly comparable GAAP measure. Net Leverage: represents Net Debt divided by Adjusted EBITDA for the trailing fiscal year. See Non- GAAP Financial Measure Reconciliations above for a reconciliation to Total debt, the most directly comparable GAAP measure. Restaurant Level Operating Profit: represents restaurant sales, less restaurant operating expenses, which include food and beverage costs, labor and other related expenses, other restaurant operating expenses, pre-opening expenses and occupancy expenses. Restaurant level operating profit excludes corporate-level expenses and other items that we do not consider in the evaluation of the ongoing core operating performance of our restaurants as identified in the reconciliation of Income from operations, the most directly comparable GAAP measure, to Restaurant level operating profit, included in the section Non-GAAP Financial Measure Reconciliations above. Restaurant Level Operating Profit Margin: represents Restaurant level operating profit as a percentage of restaurant sales. See Non-GAAP Financial Measure Reconciliations above for a reconciliation to Income from operations margin, the most directly comparable GAAP measure. Same-Restaurant Sales Growth: the percentage change in year-over-year restaurant sales (excluding gift card breakage) for the comparable restaurant base, which we define as the number of company- owned First Watch branded restaurants open for 18 months or longer as of the beginning of the fiscal year (“Comparable Restaurant Base”). For the thirteen and thirty-nine weeks ended September 27, 2026 and September 28, 2025, there were 454 restaurants and 381 restaurants, respectively, in our Comparable Restaurant Base. Measuring our same-restaurant sales growth allows management to evaluate the performance of our existing restaurant base. We believe this measure is useful for investors to provide a consistent comparison of restaurant sales results and trends across periods within our core, established restaurant base, unaffected by results of store openings, closings, and other transitional changes. Same-Restaurant Traffic Growth: the percentage change in year-over-year traffic counts using the Comparable Restaurant Base. Measuring our same-restaurant traffic growth allows Management to evaluate the performance of our existing restaurant base. We believe this measure is useful for investors because same-restaurant traffic provides an indicator as to the development of our brand and the effectiveness of our marketing strategy. System-wide restaurants: the total number of restaurants, including all company-owned and franchise-owned restaurants. System-wide sales: consists of restaurant sales from our company-owned restaurants and franchise- owned restaurants. We do not recognize the restaurant sales from our franchise-owned restaurants as revenue.